Investigating the Palaeogeography and Early Middle Palaeolithic Archaeology in the Southern North Sea
by Louise Tizzard, Andrew Bicket and Dimitri De Loecker
ISBN 978-1-874350-80-4
The potential for Middle Palaeolithic sites to survive beneath the sea in northern latitudes has been established by intensive investigation within Area 240, a marine aggregate licence area situated in the North Sea, 11 km off the coast of Norfolk, England. The fortuitous discovery of bifacial hand axes, and Levallois flakes and cores in 2008, led to a major programme of fieldwork and analysis.
Geophysical, geoarchaeological, palaeoenvironmental and archaeological datasets have been integrated producing a comprehensive understanding of the seabed and wider Pleistocene palaeogeography. Our knowledge of the early prehistoric archaeological material has been enhanced significantly; confirming that the artefacts are not a ‘chance’ find, but indicate clear, although complex, relationships to submerged and buried landscapes.
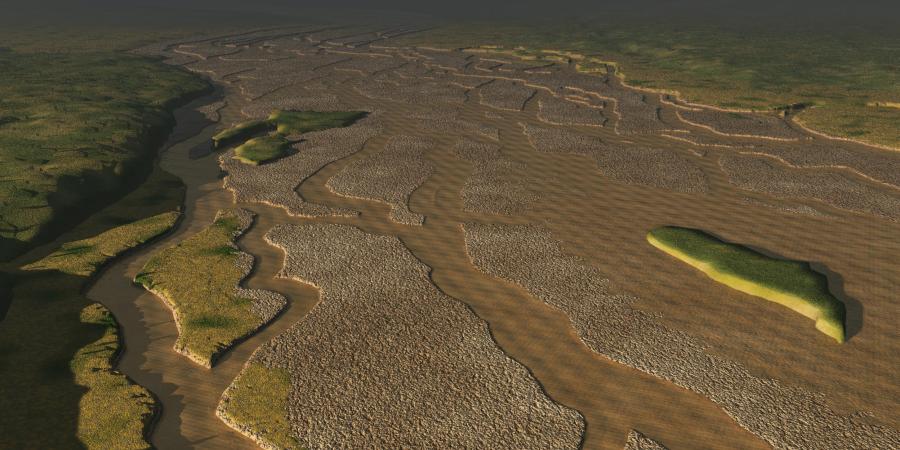
The Early Middle Palaeolithic artefacts, particularly the Levallois elements, indicate Neanderthal activity around 200,000 and 250,000 years ago apparently constrained to cold, estuarine environment of the now-submerged lower reaches of the Palaeo-Yare Valley. The exploitation of this landscape has left an archaeological record of international significance.
To find out more about this project follow this link.