Marine Geophysicist working in Offshore Renewables
I am a Marine Geophysicist and I have been working with Wessex Archaeology for nearly three years. I started my career in terrestrial archaeology, before growing to specialise in marine archaeology and marine geophysics. I have been fortunate to work all over the world on both terrestrial and marine sites, and I love to investigate how past climate has shaped our world today.
My day starts with Elda, a wriggly ginger Labrador demanding fuss, breakfast, and a walk. After I have successfully completed these important tasks, I sit at my desk with a large tea and begin by checking emails and any project updates. It is at this point I am joined by the fluffy black void, also known as Ogg the Cat, who likes to sit on my lap until my morning team meeting starts, whereupon she relocates to her tower to observe and monitor the household.
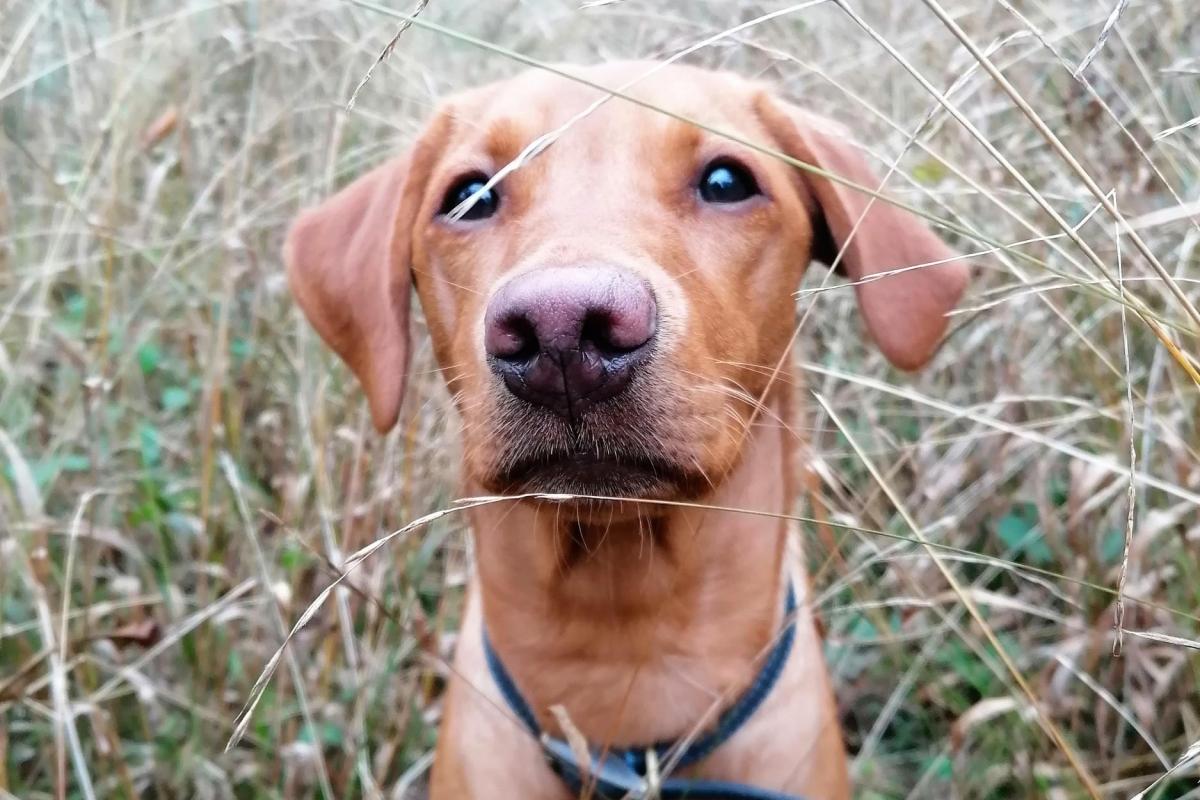
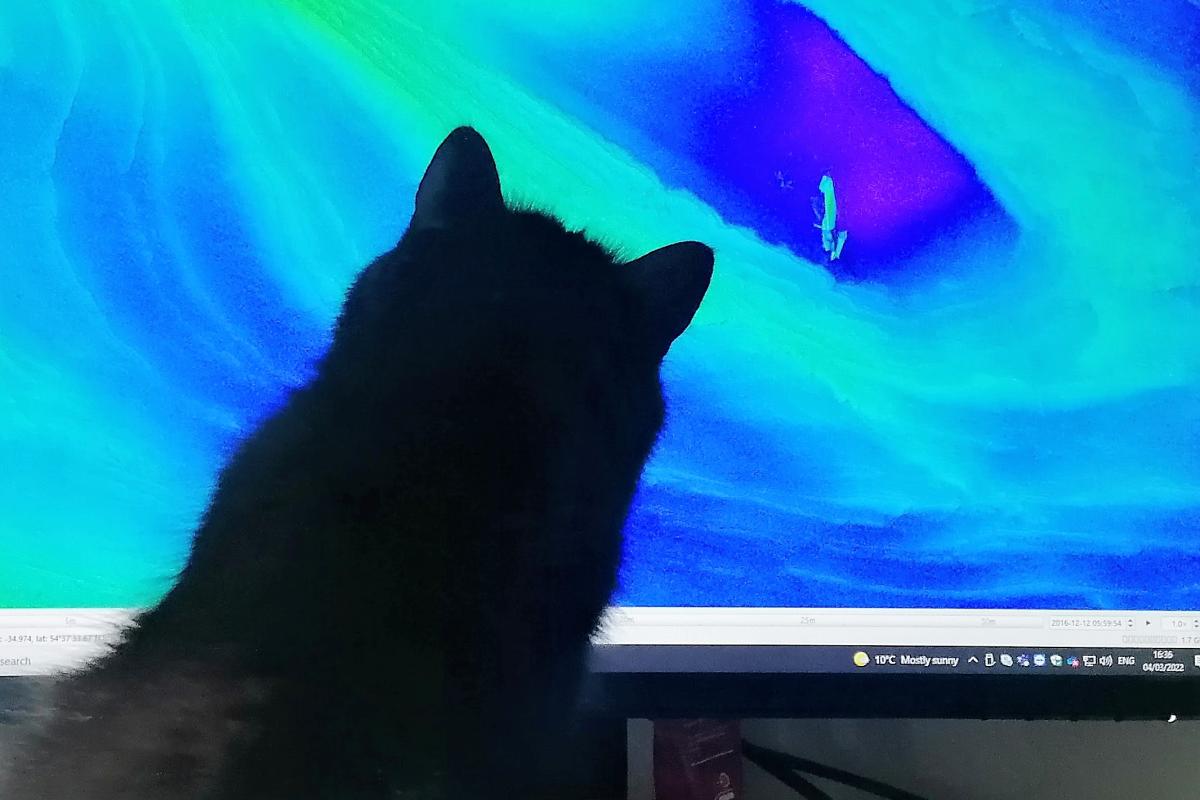
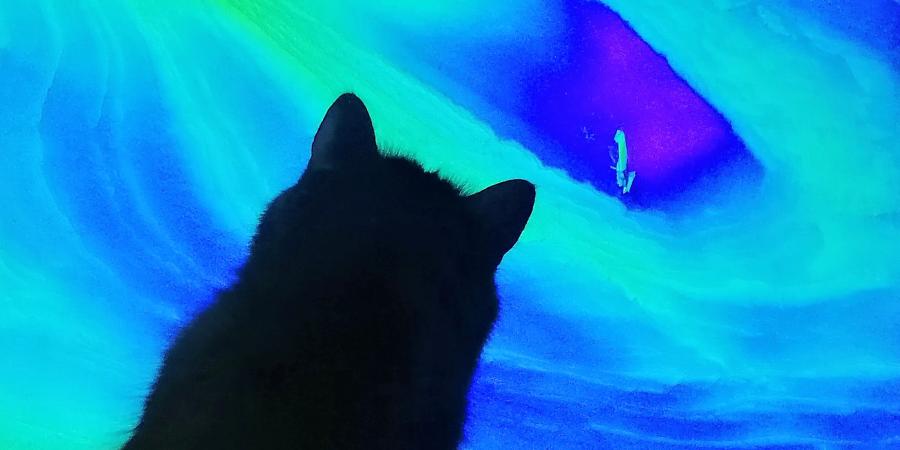
i - Elda, making sure I take regular breaks, ii - Ogg inspecting the bathymetry data
Marine Geophysics & Offshore Wind
We have a daily team meeting that has been particularly useful during lockdown; we are a team that has spent much of the last two years working from home and we largely still are. We use this time to see each other, check we’re all doing ok, and to find out how other projects are going.
Currently, we are working on several large offshore windfarm projects as we carry out a large amount of work in the renewable energy sector. Understanding the archaeological potential of an area is an important step when mitigating the impact of the development of structures on the seabed, and forms part of the Environmental Impact Assessment undertaken before any construction begins. As Marine Geophysicists, we assess different sets of data to provide as full an analysis as possible to aid in that understanding.
As part of the delivery team for an offshore windfarm, we are usually provided data which has been captured during previous surveys. Wessex Archaeology is just one company that would utilise this data – other specialists would also use it to look at bedrock geology, seafloor characterization and sediment composition, amongst other things.
Marine Geophysics Technology
I work mainly with three types of data: Magnetometry, Sidescan sonar, and Multibeam Bathymetry. Each are collected using different equipment deployed from a boat, but my favourite type is bathymetric data. These are depth data and are used to create a 3D model of the seabed; you can find more info about it here:
I would start by processing the data to get the highest quality imaging so we can look for even the smallest traces of archaeological material. Each dataset is processed in a different way and using different software:
Magnetometry
This s the measurement of the magnetic field of an area, changes to which indicate the presence of iron-rich (ferrous) material which can often be man-made. This is visualised as a continuous line representing the strength of the magnetic field, with large positive or negative changes possibly indicating ferrous material. The trick with these data is to isolate small signals of interest from the dominant background readings that make compasses point north and any higher frequency noise. Getting this right can take a lot of practice! Here you can see a section of data before and after processing, and the distinct magnetic responses indicating ferrous material - these could indicate archaeological features. This data type is especially useful for identifying ferrous material, even when buried.
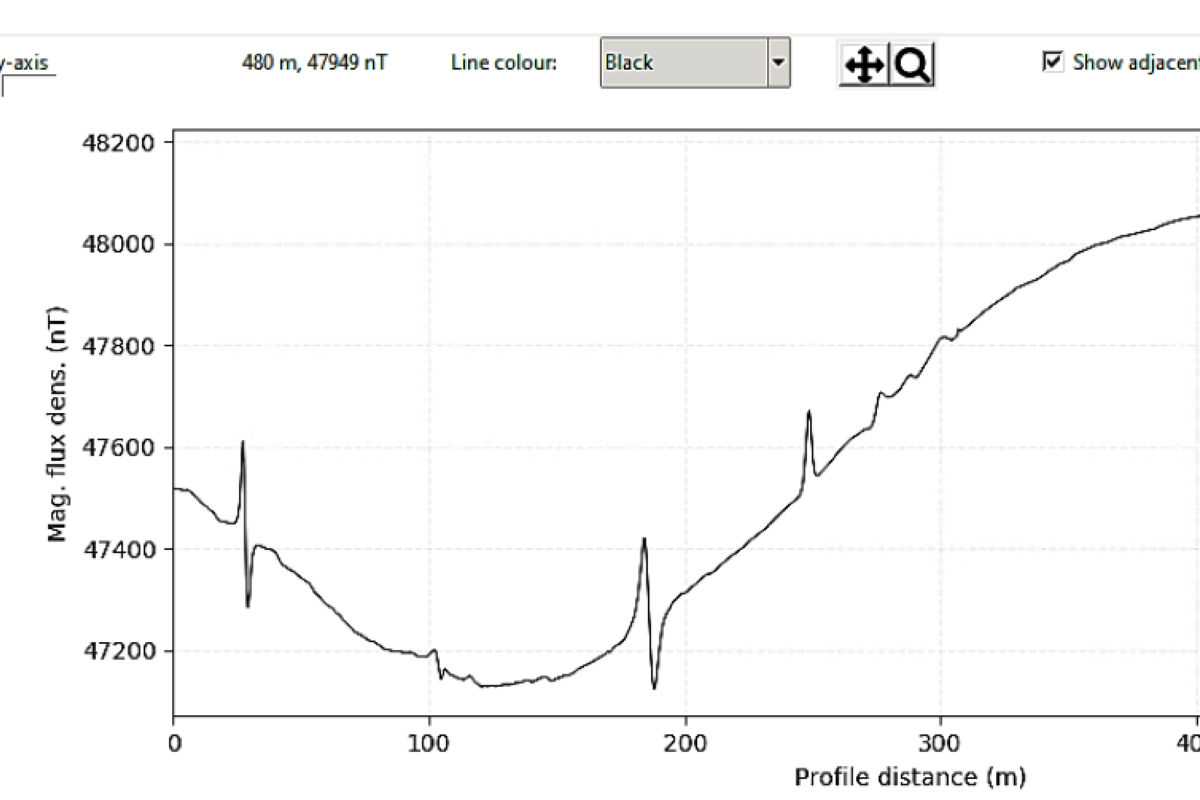
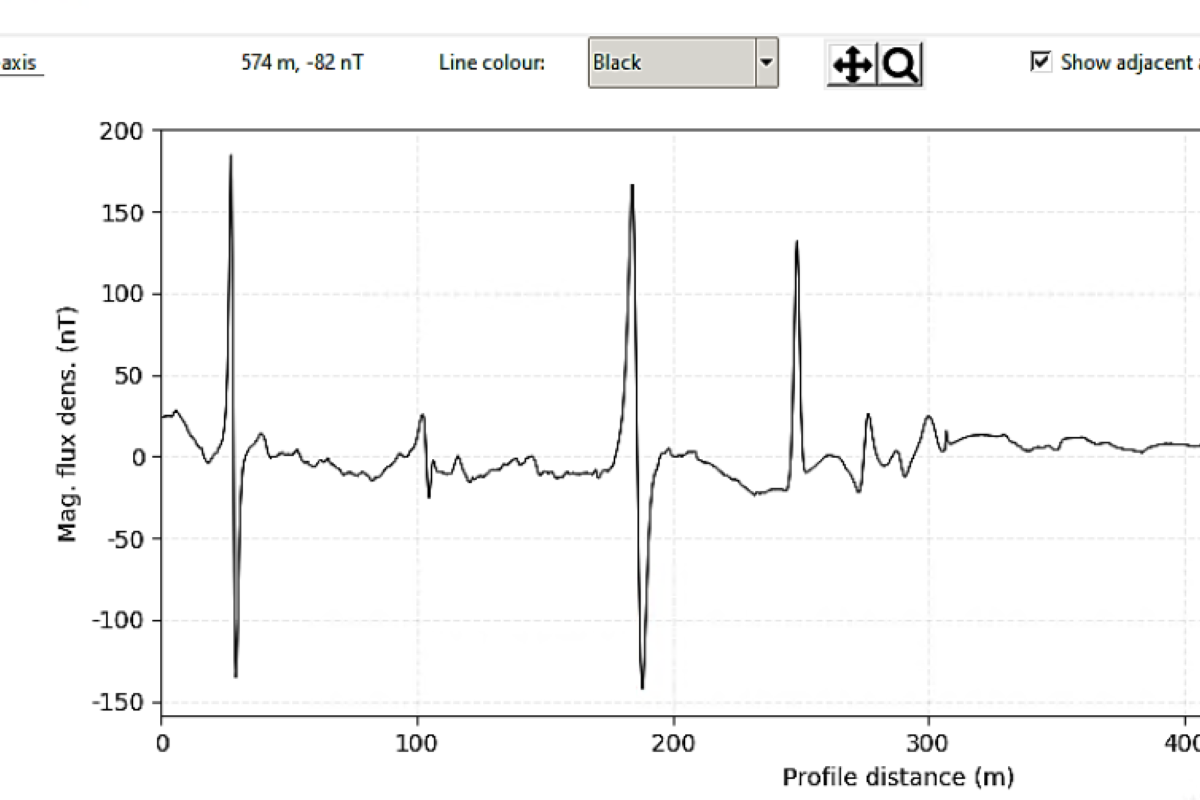
i - Magnetometry data before processing, ii - Magnetometry data after processing
Sidescan sonar
I am processing data that is captured using acoustic pulses, similar to echolocation used by bats; it is processed to deliver the most “visual” images of all the techniques. An instrument known as a towfish is towed behind the ship and sends out acoustic pulses sideways; these pulses are reflected from objects on the seabed, which are received by the towfish and the intensity of the reflections recorded. This produces a detailed image of features on the seafloor which we can use to look at objects with a really high resolution, depending on the quality of the data collected. I process this and I am looking to get as clear an image as possible by two key steps. Firstly, I need to tell the software where the seabed is, as it does not always easily recognize the gap between the sensor and the bottom of the sea. Secondly, as the data is obtained by a signal that is sent out by the sensor there is a visible difference in reflection intensity between anything closer to the sensor verses those further away – including the seabed! – and so what we call gains must be added to make sure we can evenly account for this difference so it doesn’t unfairly bias the data.
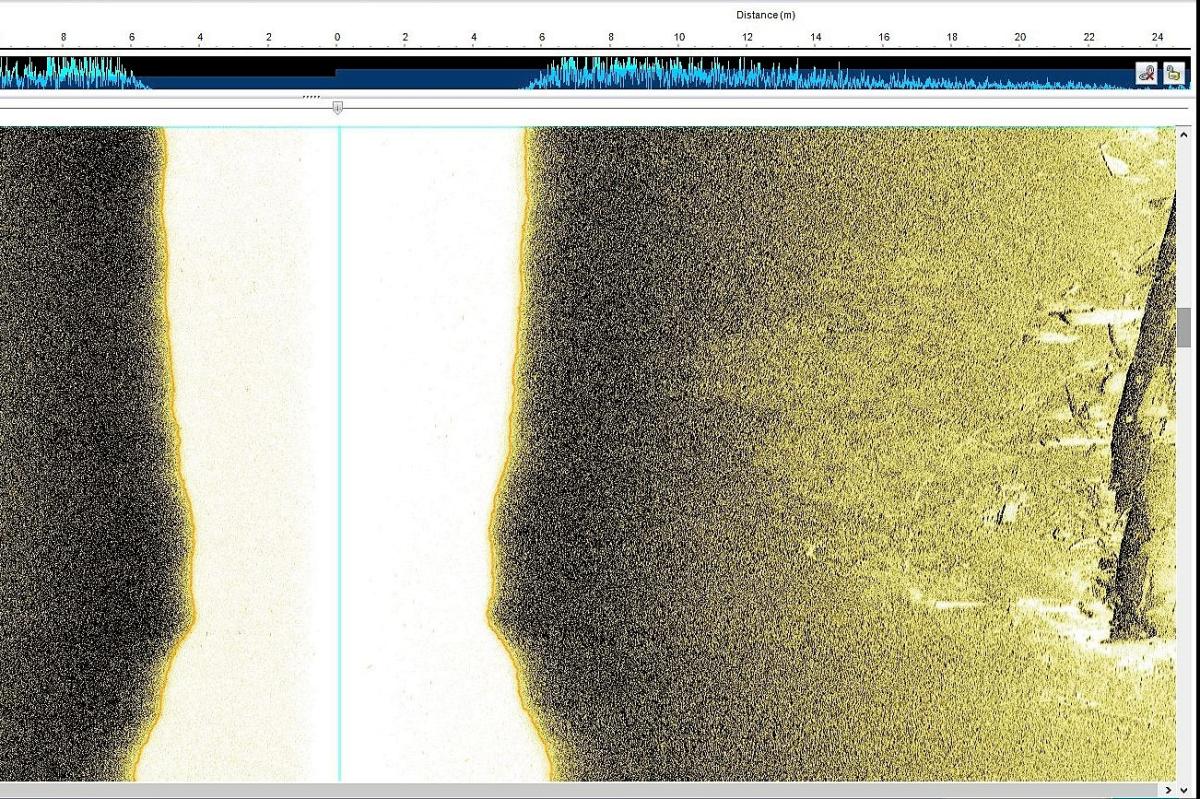
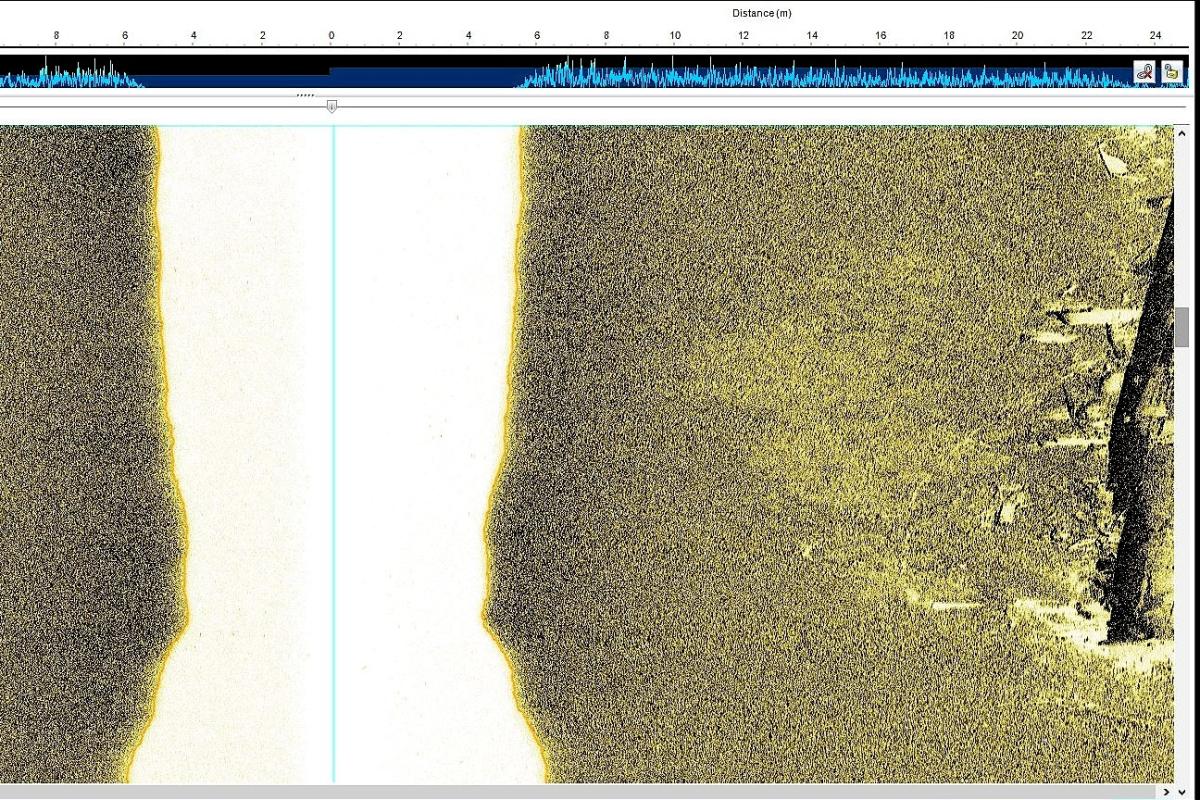
i - Sidescan sonar data before processing, ii - Sidescan sonar data after processing
Bathymetric data
This is collected using a Multibeam Echosounder (MBES) and is used to create terrain models of the seabed, and this gives the most accurately located data. It is provided by the survey company as point data, which I then grid to create a surface. This helps me look at an area as a whole and look for any features that appear unusual or stand out.
Data analysis to detect archaeological features
When each dataset is fully processed it is ready for assessment! I will then spend my time carefully looking over every section of data looking for anomalous features which may indicate archaeology. With some features it is easy to tell what they are – wrecked vessels can still be relatively intact and so they can be seen in the Sidescan sonar and bathymetry data clearly. Other times, a small angular feature in an area of round boulders can turn out to be the only visible section of a larger, buried feature.
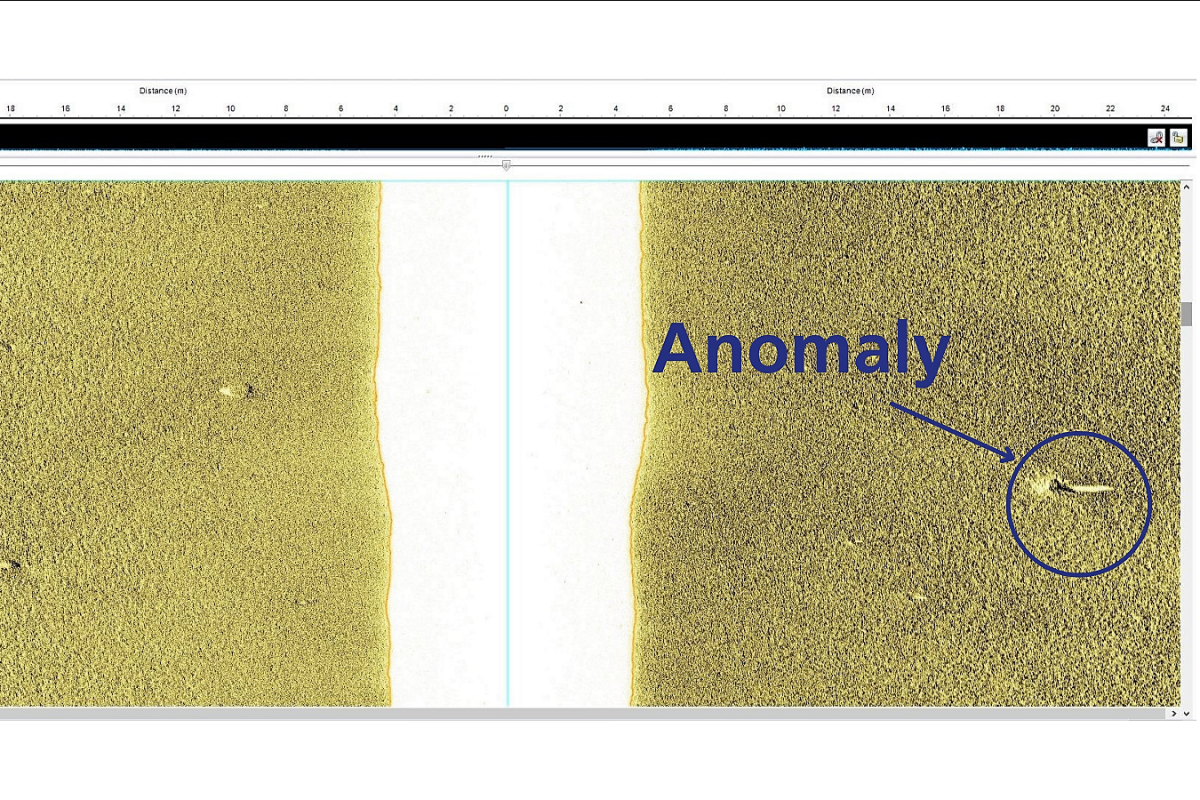
Anomalous feature
No single data type is fully or predominantly diagnostic for archaeological assessment. I use GIS software to view the spatial correlation of Mag., Sidescan sonar and MBES anomalies to better visualise features. This has yielded some of our important archaeological discoveries that any single technique may miss.
I study each of these, and sometimes I can be looking at one area in one dataset for over a week, carefully monitored by Ogg, and with breaks for walks with a determined Elda. It can be a bit repetitive, but the prospect of finding and therefore being able to help manage archaeological remains keeps it interesting - you never know what you might find!
The seabed is not static, it constantly shifts, and newly uncovered remains are located all the time. It is important that we work together to enhance the understanding of our oceans, and the way people have engaged with them throughout history.
By Robyn Pelling, Marine Geophysicist